

Surface electronic structure and isotropic superconducting gap in (Li0.8Fe0.2)OHFeSe
Heavily electron-doped iron selenide superconductors, such as AxFe2-ySe2 (A = K, Rb, Cs, Tl/K) and single-layer FeSe on oxides (SrTiO3, BaTiO3), are currently the research focus in the field of iron-based superconductors. The absence of hole Fermi surfaces, together with the nodeless superconducting gap in these materials, pose great challenges on various pairing theories. Recently, a new intercalated FeSe-derived superconductor with Tc higher than 40 K, (Li0.8Fe0.2)OHFeSe, has been synthesized. The crystal structure consists of alternating stacking layers of FeSe and (Li0.8Fe0.2)OH [Fig. 1(a)], without antiferromagnetic phase or Fe-vacancy order in the FeSe layers. Using angle-resolved photoemission spectroscopy (ARPES), Donglai Feng’s research group of Fudan University found that (Li0.8Fe0.2)OH layers dope electrons into FeSe layers. The electronic structure of surface FeSe layers in (Li0.8Fe0.2)OHFeSe resembles that of Rb0.76Fe1.87Se2 except that it only contains half of the carriers due to the polar surface, suggesting similar quasiparticle dynamics between bulk (Li0.8Fe0.2)OHFeSe and Rb0.76Fe1.87Se2 [Fig. 1(b-d)]. Superconducting gap (~10 meV) is clearly observed below Tc, with an isotropic distribution around the electron Fermi surface [Fig. 1(e, f)]. Compared with Rb0.76Fe1.87Se2, the higher Tc in (Li0.8Fe0.2)OHFeSe could be due to the superior quality of FeSe layer in this material. The (Li0.8Fe0.2)OH layer may also play an important role for elevating Tc. This work is published in Physical Rev B 2015, 92, 060504(R) as the “Editor Suggestion”.
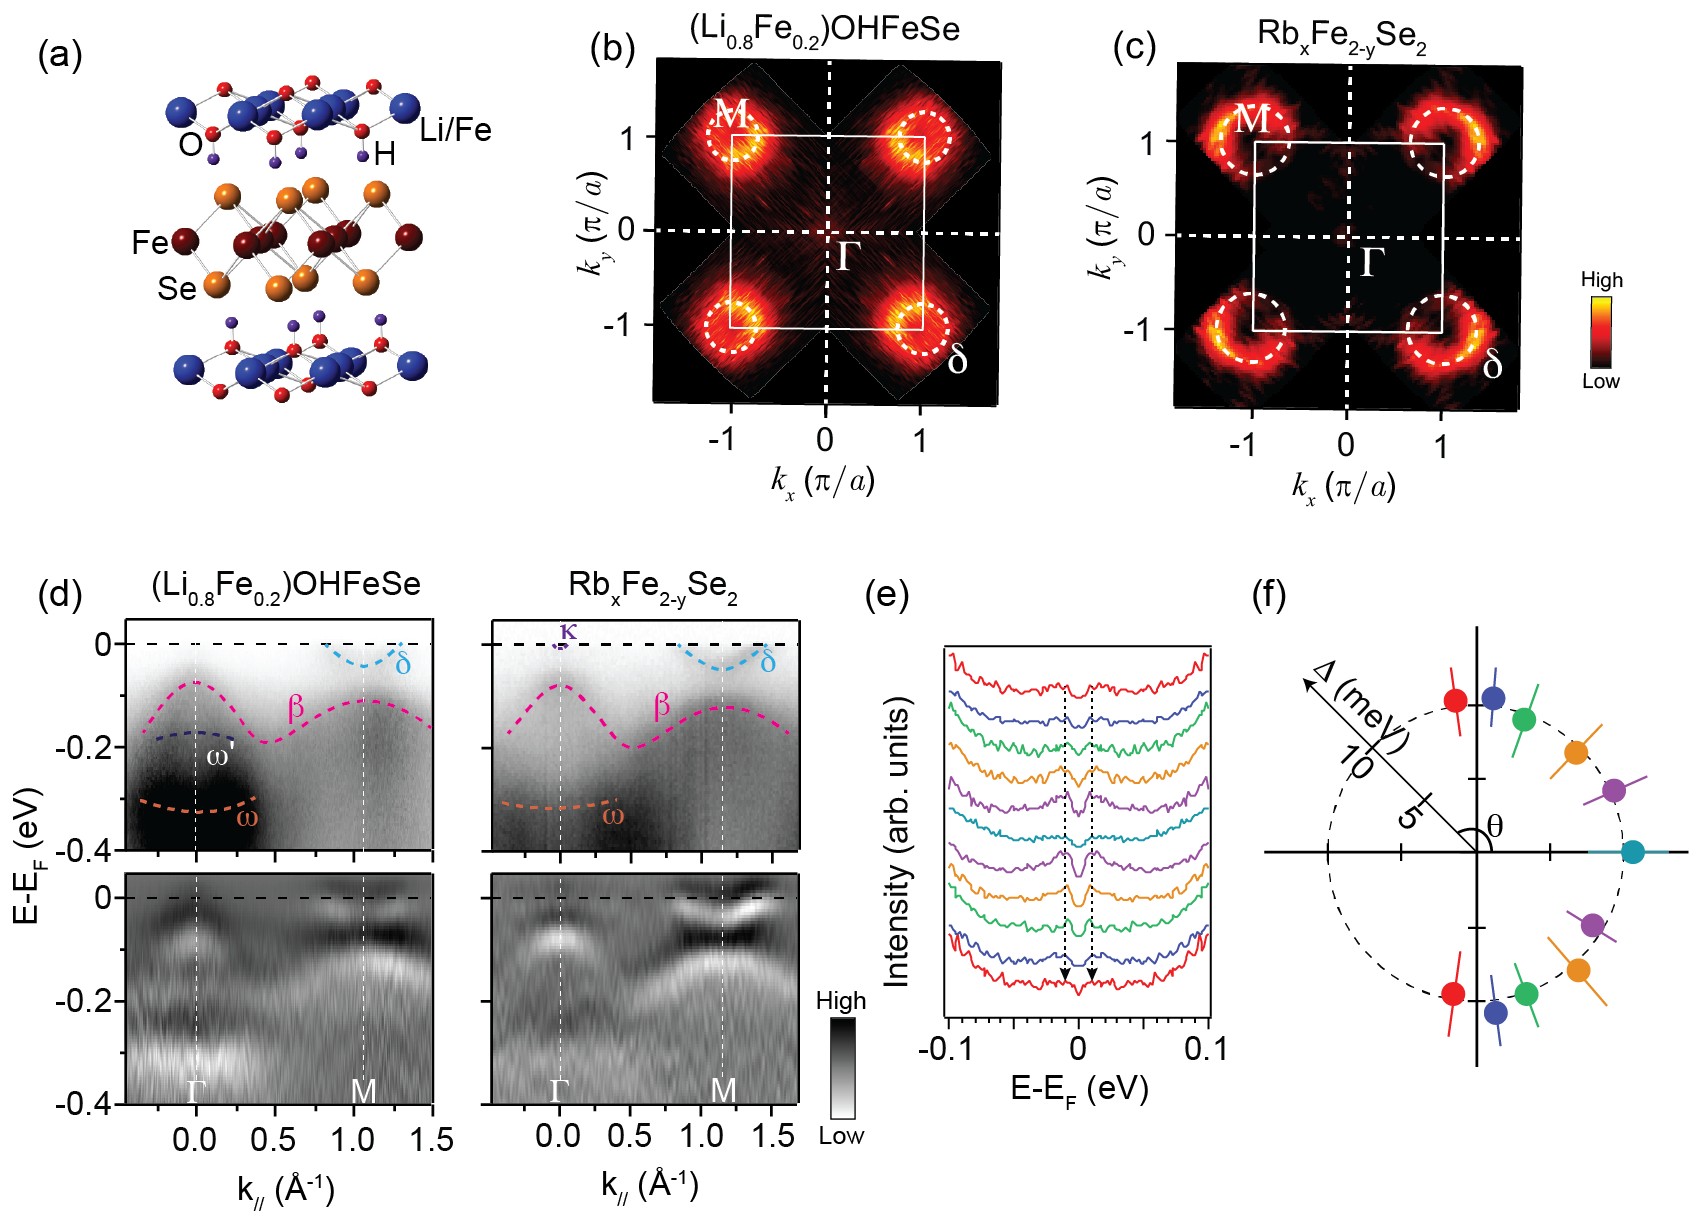
(a) The Crystal structure of (Li0.8Fe0.2)OHFeSe. (b, c) False color plots of the photoemission intensity maps at the Fermi energy (EF) of (Li0.8Fe0.2)OHFeSe and Rb0.76Fe1.87Se2, respectively. (d) Photoemission intensity and its second derivative along G-M direction of (Li0.8Fe0.2)OHFeSe and Rb0.76Fe1.87Se2. (e) The symmetrized (with respect to EF) EDCs taken at various Fermi crossings at the d band. (f) Gap distribution of the d band around M in polar coordinates, where the radius indicates the gap size, and the polar angle q represents the angle on the d band with respect to M, with q= 0 being the G-M direction.
1.jpg
Back